Semrush Traffic Analytics: What exactly does it do? Well, imagine there’s a domain owned by your competitors. Now, imagine a tool which gives you access to the domain’s Google Webmasters data.
Semrush Traffic Analytics is that tool. It gives you everything that Webmasters shows the domain owner on top of a ton of extra data and information which even Webmasters lacks.
I won’t say much, if you’re into SEO, even by the remotest definition, Traffic Analytics is something that you should at least peek at.
And hey, it’s forever free! You start with a Semrush 14 day free trial account, and then get a forever free account anyway. So, you can always try it on your own without spending a penny, ever!
Start Semrush 14-days Free Trial Now
Table of Contents
What is Semrush Traffic Analytics?
As the name suggests, it’s a feature from Semrush which shows traffic data. In simpler words, it shows where a website is getting traffic from, where they go after visiting the domain, what sources your competitors use for pulling traffic and a lot more.
It isn’t some other/additional tool. It’s a feature that’s found in all Semrush accounts. Within itself, it has three primary features that it facilitates:
- Check an individual domain’s traffic data
- Compare domains against each other
- Analyze in bulk: Allows analyzing 200 domains at a time!
Also, it’s just one of Semrush’s 60+ different features such as rank tracking, keyword research, keyword and backlink gaps, automated organic backlink builder, on-page SEO reports, A-Z content marketing suite and a lot (lot) more.
However, the level of data Traffic Analytics displays totally deserved its own piece so here I am.
Let’s see what it can do then?
If you’re short on time, you can try Semrush 100% free for the next 14-days! Go test it all out on your own!
Start Semrush 14-days Free Trial Now
Spying on competitor traffic data: An overview
Using the feature is extremely easy.
In this example I’ll use EngageBay.com. It’s the CRM I personally use and love. They aren’t my competitor but I’d love to know how they skyrocketed to success.
Side note: You totally should check my EngageBay vs. Hubspot comparison.
Do note that Semrush is also capable of displaying data exclusively for subdomains, as well as subfolders.
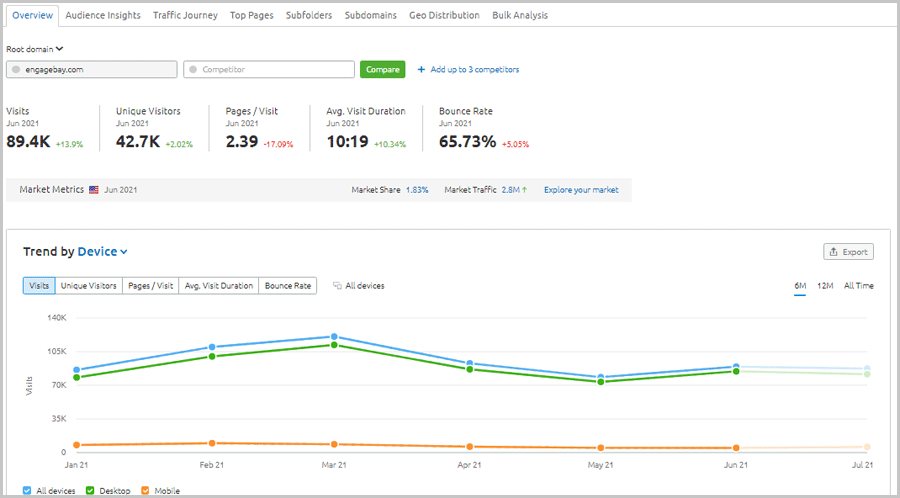
Anyway, here’s the general overview which I get when I enter a domain for analyzing:
- Total visits on the domain: This is the total number of visitors, including returning visitors.
- Unique visitors (excluding returning visitors)
- Pages/visit: This is the number of pages a user visits when on the site.
- Average time a user spends on the site
- Bounce rate: This helps me understand how my competitors’ traffic is reacting to their content.
In smaller red/green text, Semrush also shows the positive/negative change in these numbers. This tells me if my competitor is going up or down as compared to a previous performance.
I’m a fan of finer details. The small things make all the difference, right? Semrush offers a ton of that:
So, for starters, Semrush lets me choose the exact month for which I’d like these numbers. Secondly, it displays global data by default. However, I can choose to see traffic analytics for any country specifically.
That’s perfect when you’re targeting different regions than your competitor and need to get granular data, right?
What’s more? I can even filter the results based on devices! I can switch between:
- Mobile
- And desktop
And finally, it even shows data accuracy! Well yes. This is why I stuck with Semrush for so long, their transparency. It tells me how accurate the displayed data is.
Traffic based on “Device” of the visitor
Mobile traffic has accounted for over 55% of all internet traffic in 2020 globally. Clearly this means we can’t just focus on desktop users anymore, right?
Semrush understands this and shows us separate data for each!
In the screenshot above, I can choose to show/hide data from either mobile or desktop users.
Moreover, I can even filter the traffic using the tabs provided on the graph. I can isolate individual data streams, such as “all visits”, “unique visits”, “bounce rate” and everything else that the general overview showed me.
On the extreme right (refer to the screenshot above) I can also choose a time-frame for this data. I can choose to view data for 6months, 12 months or all time.
If you scroll down on this dashboard, it shows a lot of other data. Easy to understand charts & graphs are used to display all the information.
However, all of this can be accessed in detail. So, let’s just discuss those detailed reports directly?
Audience Insights
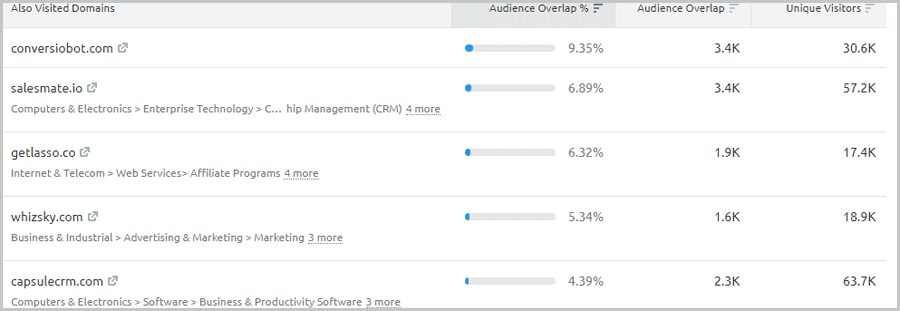
This is pretty “magical” or “spy-like’. This tab shows which other domains were visited by the visitors on my competitor’s domain.
Note that this isn’t a “before or after” case. Meaning, the tab isn’t showing me which domains were visited just after or just before visiting my competitor. (Semrush does have a feature for that, scroll down).
Rather, it’s a list of other domains that my competitor’s visitors visited at any time in general.
There’s a metric showing “audience overlap”. This is the percentage of visitors common to the domain I entered, and the domain shown on this list. An exact number of audience overlap too is shown.
I personally use it to publish guest posts on these additional sites which my competitors’ visitors visit. This way, I’m marketing directly to my competitor’s audience without my competitor even knowing about it!
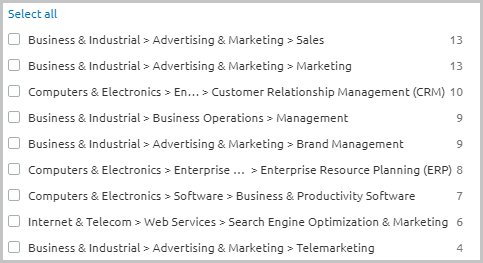
This page even has a “category” filter. So, imagine I just wish to find the “business” sites or the “arts” site that my competitor’s visitors visit. I can do that with a single click!
The traffic on each of these individual domains too is shown. Helps me pick the domains where my guest posts or ads will have the maximum impact!
Traffic Journey
If you wish to know exactly which sources are sending traffic to your competitors, and how much ,this is the feature for you.
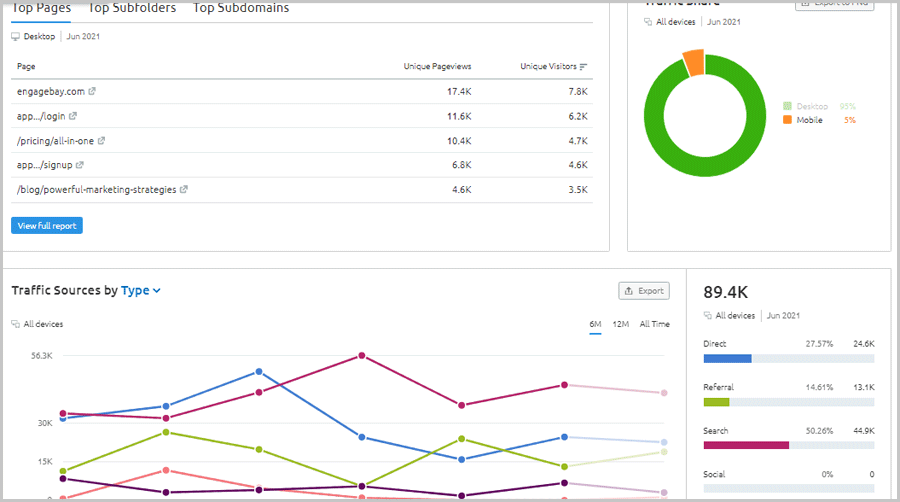
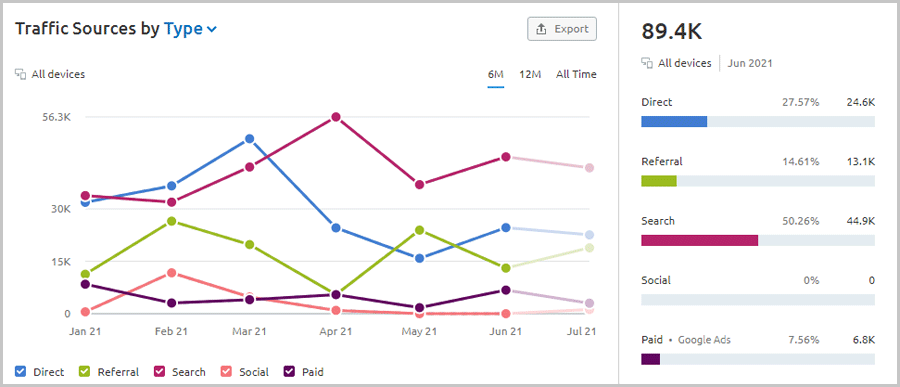
By default, it shows me a colorful line graph. This contains data about traffic “type”.
It tells me if the traffic is:
- Direct: Not coming from search/ referral/ social media or ads.
- Referral: Traffic originating from backlinks and other similar sources.
- Search: This is basically the organic traffic coming in directly from search engines.
- Ads: I’m not telling you what this means, go figure (:p).
Again, I can isolate individual traffic sources on the graph. Doing that only keeps the respective line and hides the rest.
In the screenshot above, the right-pane shows the same data numerically. It tells me exactly what % of the domain’s traffic is from which source. Exact numbers for all the different traffic sources too is displayed.
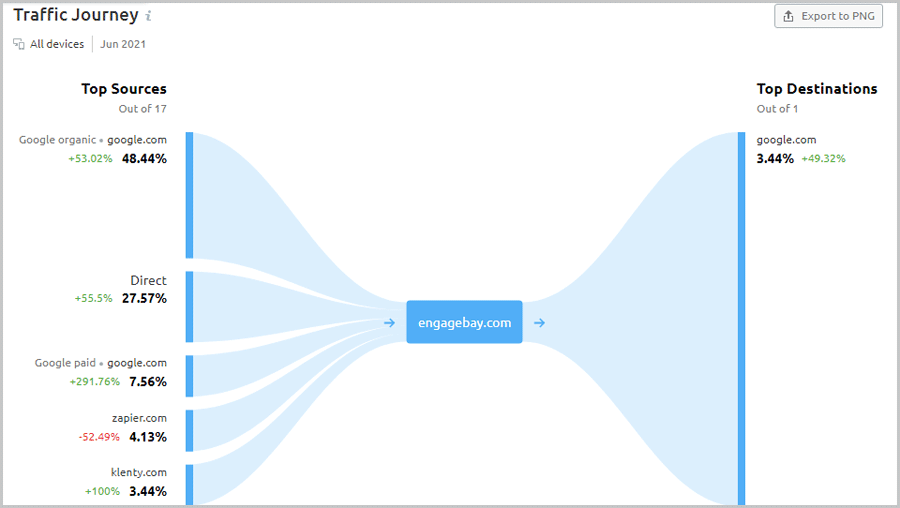
The same page also displays another chart. This shows me the top traffic sources for the domain I’ve entered. It also shows the top 5 outgoing destinations users visit directly from the domain. In other words, it shows the websites users visit just before and just after visiting the domain I’m analyzing.
This chart shows more detailed data. It shows the exact domains sending most traffic to the domain. Similarly, it also shows the exact domain(s) visitors go from this analyzed domain.
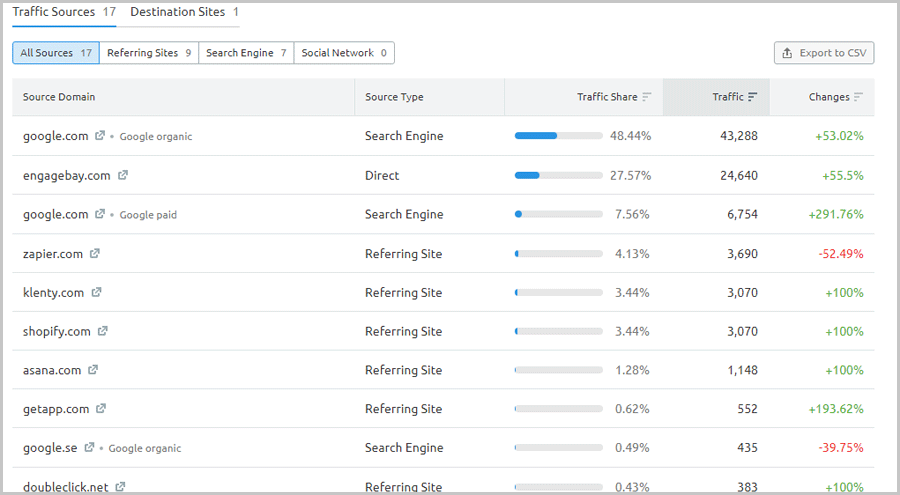
It all feels like an “overview”, right? Well, the page also shows a mega list with every piece of data you may ever need.
As the screenshot above shows, I get a list of:
- Exact domains sending traffic to the entered domain
- Source type
- Traffic share generated by each individual domain
- Exact no. of hits each domain sends to the domain I’m analyzing
- The % change in traffic from each source.
That’s pretty detailed, isn’t it? If you read my Semrush vs. Similarweb comparison, you’d see how Semrush truly outperforms nearly every tool out there.
Top pages/subfolders and subdomains on a domain
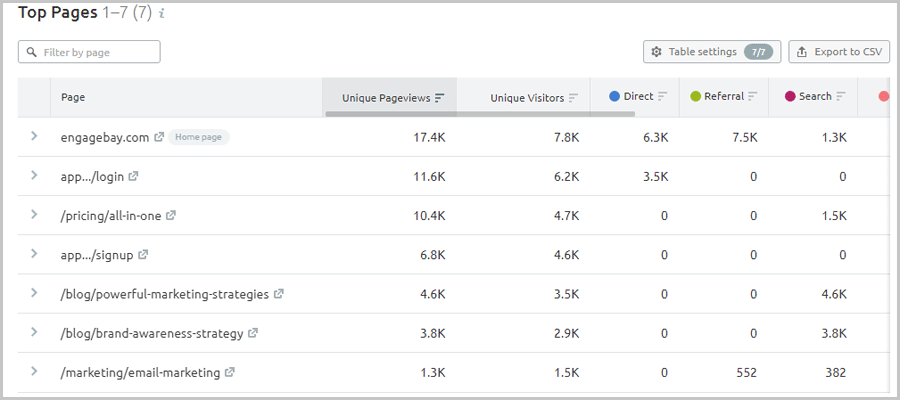
You can also find a “top pages” tab on the Traffic Analytics feature.
It’s pretty self-explanatory. It shows me the pages which receive the maximum traffic on the domain I’m analyzing.
Although, it also includes additional data such as unique hits/ unique pageviews/ exact no. of traffic from different sources.
Now it’s perfect for keyword research! Wait, hear me out! These pages are the pages which are receiving maximum traffic on the competitor’s site. That means, these are the keywords you shouldn’t miss by any chance, right?
Obviously it won’t work if you go copying keywords for a site that has a lot more authority than you. But for similar sites, you’ve just as much chance of ranking for these keywords as your competitors!
You should read my (very) detailed Semrush review. It has dedicated keyword gap/backlink gap and many other features which make SEO seem like child’s play!
Geo Distributions
I’ve always loved Semrush’s level of “detail” that it provides with any of its features. You’ll soon see what I’m talking about.
Anyway, its “Geo Distributions” tab shows the countries sending data to the domain.
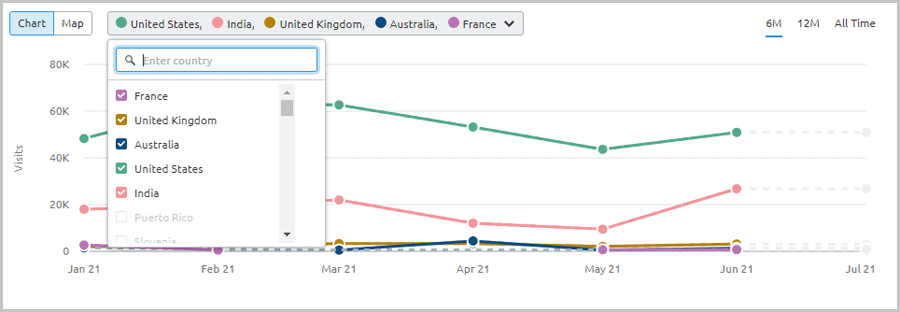
The top 5 countries are plotted by default on the chart. However, I can search for any other country just as easily.
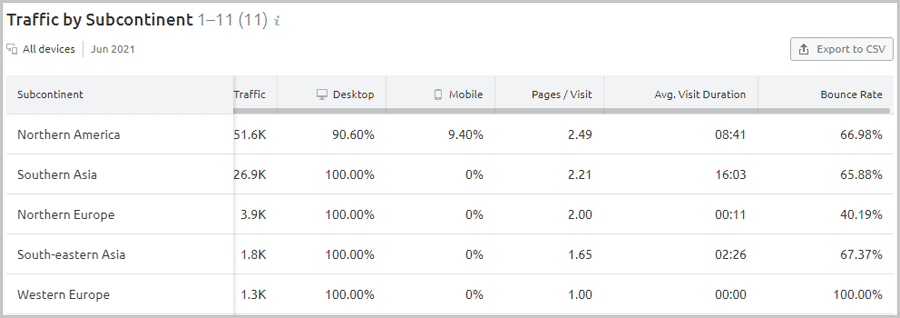
Additionally, I can also switch to a “subcontinent” view. The chart then replaces the “countries” with “subcontinents”.
Obviously I can also isolate individual countries and view specific data if that’s what I need.
It also provides a “map” view. It basically displays a world map and colours the countries sending traffic to the domain. The density of the colour (which is blue by default) tells me which regions love the domain most.
The chart obviously is just an overview. The same page also displays a list, which tells me the following data for every individual country:
- Traffic share (in percentage)
- Exact traffic count
- Desktop vs. Mobile traffic
- Pages/visit
- Average visit duration
- And Bounce rate.
Comparing domains/ Competition Analysis
At the very beginning of this Semrush Traffic Analytics review, I said it allows analyzing competing domains, didn’t I?
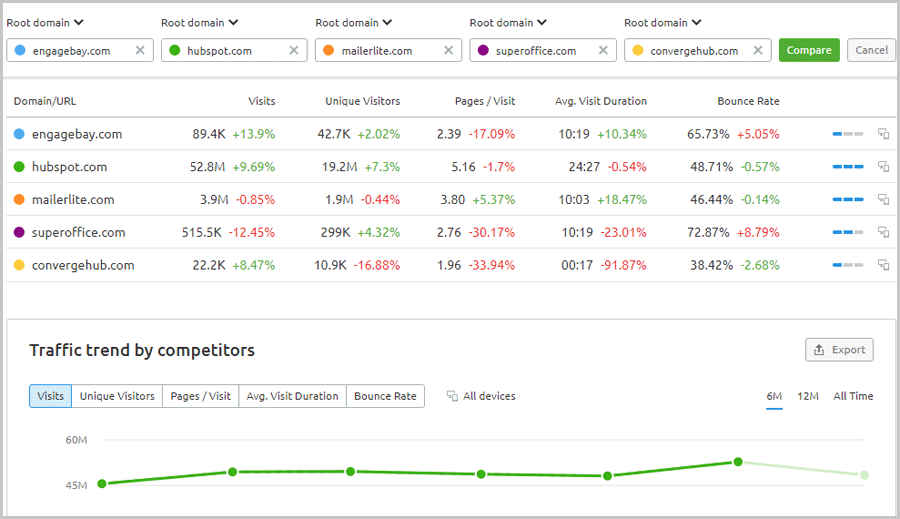
Semrush allows comparing up to 5 domains at once! Don’t have a competitor list? No issues! Just enter a single domain. It auto-suggests the top competitors for the domain!
Everything that I discussed in this article is then compared side-by-side for each domain!
In fact, if you use its “Bulk comparison” tool, it allows comparing as many as 200 domains at once! That’s literally the biggest number any tool offers in the entire industry.
Semrush Traffic Analytics: Is it worth it?
Yes, it’s more than worth it! That’s because this is a single feature, and you get about 59 other features with any Semrush plan, even the forever free version!
Keeping my personal love for Semrush aside, if you went through this piece, you’d agree it’s very informative and detailed, wouldn’t you?
You get to dissect your competitor’s strategies to its core, especially if you use the other features Semrush offers (such as backlink gap/ keyword gap /domain overview etc.)
Here’s the thing. You shouldn’t buy Semrush just because I say so. But you sure can give it a try if it’s free for half a month, right?

